Article Reader

Government of India has floated a scheme RGESS (Rajiv Gandhi Equity Saving Scheme) under which taxpayers can get tax benefit for investing in the stock market. This benefit is in addition to regular deduction available under u/s 80C. This Scheme would give tax benefits to new investors who invest up to Rs. 50,000 (or Rs.1,50,000 across three consecutive years) and whose annual income is below Rs. 12 lakh. One of the conditions under this scheme is that there is a lock-in for 3 years and the stocks must be selected from top 100 stocks listed on the stock exchange. Details of this scheme are available at the following link. http://rgess.com/ http://www.bseindia.com/rgess/ http://finmin.nic.in/RGESS/rgess_index.asp We compared the constraint imposed by the scheme and APS recommendations (Rule-ADX). Our first two rules are directly aligning with the constraints. Rule-A suggests investing within top 500 companies while this scheme is asking to invest within top 100. Hence, the scheme constraint is a subset of Rule-A recommended stocks. Rule-D asks for diversity across various leading sectors and top 100 stocks represents all such sectors. Lock-in for three years is similar to our spot scenario (Buy and hold for long period). Our statistics based result (based on Portfolio Builder) suggests such strategy on an average, returns 14% annual profit (80% investors in range of 9 to 19%) for BSE 500 stocks if held for 5 years.
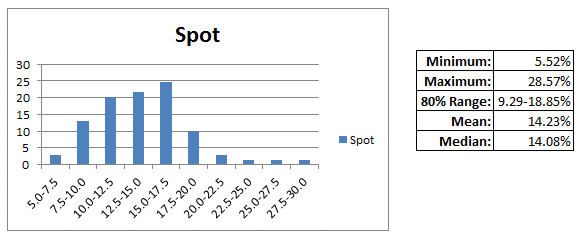
Return on Investment (CAGR) Pattern for Stocks Selected According to Rule-D and if the investor held the Stocks for Next 5 Years (Scope: BSE500)
For NIFTY 50 again this result is almost very close, so, we assume the result for top100 stocks should be the same. http://www.safetrade.in/NiftyAndAPS.aspx Our assumption is that the investor is in higher bracket of the income and pays 30% tax for any additional income. If such a person is investing Rs.50,000 in stock market under RGESS scheme, then Rs.25,000 (50% of invested value) of his/her investment will attract tax benefit which will be equivalent to Rs.7,500. Effectively the person is spending Rs.42,500 and buying Rs.50,000 worth stocks. Assuming his/her return will fall in 80% scenario of spot return then following will be the potential range of his investment value down the three years.
| Minimum | Median | Maximum | |
|---|---|---|---|
| Money Multiplication factor (In 3 years) | 1.295(9% p.a) | 1.480(14% p.a) | 1.685(19% p.a) |
| Minimum | Median | Maximum | |
|---|---|---|---|
| Money Multiplication factor (In 3 years) | 1.524 (15.1% p.a) | 1.740(20.3% p.a) | 1.980(25.6% p.a) |
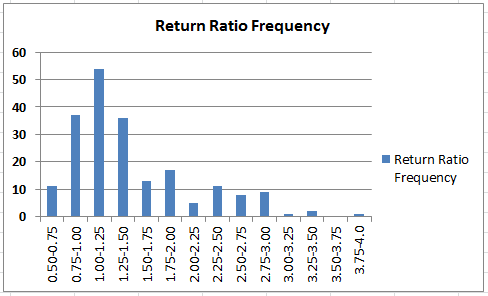
Nifty 3 Year Return Ratio Across Last 20 Years(Distribution)
Median Ratio: 1.256 (equivalent to 13.9% return after tax benefit) 80% Range: 0.86 to 2.50 (equivalent to 0% to 43% return) Chances of making loss: 9% Maximum loss: 9% (During March 2000 to March 2003) Following graph is showing an alternative way to look at the same data. Instances when Return Ratio line (red line) has gone below green dash line are only when investors have lost money otherwise everywhere they have made profit. Instances which are above solid green lines have beaten return from fixed deposit (post tax).
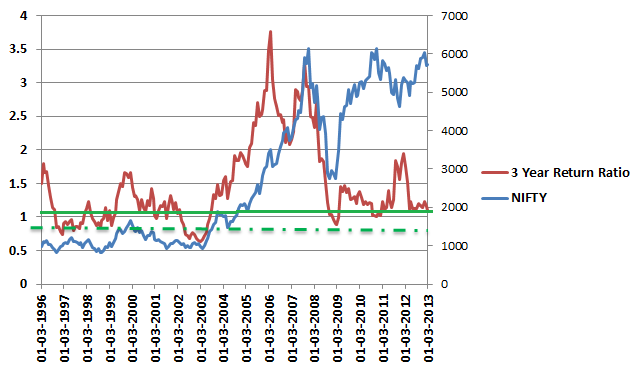
Nifty 3 Year Return Ratio Across Last 20 Years(Timeline)
A perfectly diversified portfolio (following Rule-D) has improved median return ratio to 1.48 and 80% range moved up to 1.295 - 1.685. In terms of percentage return it is 15.1 to 25.6% per annum. Now, coming to alternative options, let us assume investor invested the money in fixed deposit. In this case investor will lose Rs.7,500 (the benefit RGESS was giving upfront) tax benefit and will have Rs.42,500 for investment. Assuming the investor got very good deal of 9.5% return(FD). In such scenario, Rs.42,500 will become Rs.55,800 in three years. On fixed deposit interest one has to pay 30% tax on the interest. 30% of 13,300 (55,800 – 42,500) is Rs.3990. So, net return is Rs.51,810. This is equivalent to 6.6% annual return. Comparing with RGESS scheme return, it is less than half of bottom 10%* and less than 1/3rd of median investors under RGESS scheme. We also analysed another scenario where person would like to invest in tax saving mutual fund (commonly known as ELSS) to bypass the tax. This case is not exactly overlapping with RGESS case because tax-saving mutual funds come under u/s 80C while RGESS is beyond that. Still, we analysed the performance of tax saving mutual funds and RGESS (with right diversity). From available data on valueresearchonline.com (31st July 2013), we found that median return of funds under this category is -0.6% per annum and 80% funds are in the range of -1.74 to 3.79%**. Value of investment of Rs.1,00,000 , 3 years back is in the range of Rs. 94,870 to Rs.1,11,800 now (median Rs. 98,200). Do we really need to calculate further? In brief even after paying tax at both ends (before investing and after receiving interest), in more than 70% cases fixed deposit is a better bet than locking money in such inefficient funds. In other words FD is much better than ELSS (Equity linked saving scheme) and RGESS is above all. In the beginning one time investment of Rs.1,00,000 was permitted under this scheme. Recent change allows to investment of Rs.1,50,000 across three years (Rs.50,000 each consecutive year). This change has more positive impact on the investment as market risk gets spread across time. We did a calculation based on Sensex performance and assumed that the investor has invested Rs.50,000 three consecutive years. He withdraws on completion of 5 years. Our calculation suggests that median return of such investment has yielded 15% year on year and in more than 90% case it has yielded more than 12% (tax free)
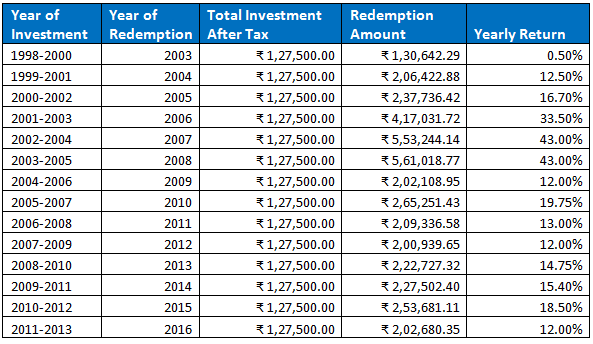
RGESS Return On Investment in 3 Years Scenario
Median return has just improved by around 1%, if we compare it with single time investment for 3 years return ratio. However, we can see this time loss has not been registered which was around 10% of the time in single investment case. Hence, investment spread across three years has further impacted us positively. Conclusion: RGESS is a very good opportunity to get exposure to stock market for first timers (only applicable to Indian tax payers). In a way govt. is giving 15% cushion upfront for covering potential loss in the market. This support is improving chances of investors to make profit by more than 90% and in 75% investors are most likely to beat fixed deposit return. A Portfolio formed using Rule-D has further reduced the risk zone and result is showing in more than 90% cases such investors will enjoy more than 15% return on their investment after tax benefit. If an investor chooses to invest 3 years in a row then the chance of loss drops down to zero and median return is more than 15% year on year (tax free). Hence, one should not miss this opportunity to save tax and enter in market at theoretically zero risk. If you are interested in the list of stocks which is diversified according to Rule-D, suites your risk profile, and best at the moment according to our Relative Beta model then write to support@safetrade.in
* We have covered 80% range. So, only 10% are below minimum, rest 10% are above maximum value **Click here to see ELSS Funds Return in last 3 years