Article Reader

APS, Rule-X, & NIFTY Performance(July 2013)
Reporting Day: 20th August 2013 Recently, we came out with our analysis of Rule-X against single day fall of NIFTY(NIFTY Mayhem and Rule-X). We have also provided Portfolio Builder tool to validate the performance against historical data. In this article we have covered single month performance (July 2013) for complete review of APS/Rule-X. Our performance benchmark is NIFTY. NIFTY has historically returned decent profits in the long term (NIFTY Historical Performance), so, if our strategy is performing better than NIFTY it will also yield decent returns (or better than NIFTY). Professional fund managers also measure the effectiveness of investment strategy against such benchmark. Any extra percentage gain (or save in case of loss) against benchmark is called Alpha. If a strategy can generate overall (portfolio wide) alpha then it is considered a good strategy. We have taken investment period 1st July 2013 to 31st July 2013 and valuation has been done on 20th August 2013 (End of the day). During this period NIFTY has lost value by 8.43%. At the same time if an investor would have followed just Rule-X triggers (on daily basis) then such investors would have lost just 2.76%. APS which is a combination of three rules Rule-A, Rule-D, & Rule-X and advocates only weekly trading has made loss of 2.56%. Following is the graphical representation of the same.
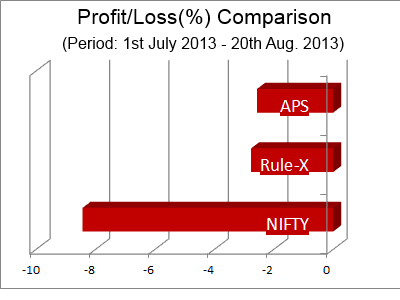
Relative Profit Loss Comparison
It is evident that both kinds of investors have been successful in generating alpha. Coming down to more microscopic view of the trades recorded during the same phase.
| StockID | Name | Trigger Day | Enter Price | Last Trade Day | Last Trade Price | NIFTY Start Price | NIFTY End Price | Rule-X PL(%) | NIFTY PL(%) | Has Alpha |
|---|---|---|---|---|---|---|---|---|---|---|
| 506480 | GULF OIL CORPORATION LTD. | 01-07-13 | 75.5 | 67.15 | 5,898.85 | 5401.45 | -11.06 | -8.43 | NO | |
| 532478 | UNITED BREWERIES LTD. | 02-07-13 | 865.55 | 651.2 | 5,857.55 | 5401.45 | -24.76 | -7.79 | NO | |
| 532938 | CAPITAL FIRST LIMITED | 03-07-13 | 154.95 | 150.1 | 5,770.90 | 5401.45 | -3.13 | -6.4 | YES | |
| 523457 | BOC INDIA LIMITED | 08-07-13 | 263.55 | 249.15 | 5,811.55 | 5401.45 | -5.46 | -7.06 | YES | |
| 532129 | HEXAWARE TECHNOLOGIES LTD. | 08-07-13 | 93.6 | 113.95 | 5,811.55 | 5401.45 | 21.74 | -7.06 | YES | |
| 532312 | GEOMETRIC LTD | 10-07-13 | 100.55 | 30-07-13 | 79 | 5,816.70 | 5755.05 | -21.43 | -1.06 | NO |
| 532254 | POLARIS FINANCIAL TECHNOLOGY LTD | 11-07-13 | 113.55 | 31-07-13 | 99.9 | 5,935.10 | 5742 | -12.02 | -3.25 | NO |
| 500209 | INFOSYS LTD | 12-07-13 | 2802.75 | 3007.1 | 6,009.00 | 5401.45 | 7.29 | -10.11 | YES | |
| 532927 | ECLERX SERVICES LIMITED | 15-07-13 | 799.05 | 771.55 | 6,030.80 | 5401.45 | -3.44 | -10.44 | YES | |
| 533293 | KIRLOSKAR OIL ENGINES LIMITED | 15-07-13 | 182.9 | 19-07-13 | 175.15 | 6,030.80 | 6029.2 | -4.24 | -0.03 | NO |
| 522074 | ELGI EQUIPMENTS LTD. | 16-07-13 | 90 | 13-08-13 | 77.6 | 5,955.25 | 5699.3 | -13.78 | -4.3 | NO |
| 500302 | PIRAMAL ENTERPRISES LIMITED | 17-07-13 | 569.7 | 578 | 5,973.30 | 5401.45 | 1.46 | -9.57 | YES | |
| 506390 | CLARIANT CHEMICALS (INDIA) LIMITED | 17-07-13 | 510.3 | 479.65 | 5,973.30 | 5401.45 | -6.01 | -9.57 | YES | |
| 507685 | WIPRO LTD. | 17-07-13 | 386.45 | 447.7 | 5,973.30 | 5401.45 | 15.85 | -9.57 | YES | |
| 500182 | HERO MOTOCORP LIMITED | 29-07-13 | 1874.25 | 1899.45 | 5,831.65 | 5401.45 | 1.34 | -7.38 | YES | |
| 532900 | S E INVESTMENTS LTD. | 29-07-13 | 392.05 | 391.3 | 5,831.65 | 5401.45 | -0.19 | -7.38 | YES | |
| 533155 | JUBILANT FOODWORKS LIMITED | 29-07-13 | 1129.8 | 07-08-13 | 1068.5 | 5,831.65 | 5519.1 | -5.43 | -5.36 | NO |
| 531642 | MARICO LIMITED | 30-07-13 | 214.65 | 07-08-13 | 201.6 | 5,755.05 | 5519.1 | -6.08 | -4.1 | NO |
| 531213 | MANAPPURAM FINANCE LIMITED | 31-07-13 | 12.74 | 14.93 | 5,742.00 | 5401.45 | 17.19 | -5.93 | YES |
Even at each stock level we have alpha in 11 stocks out of total 19 positions taken. Nearly 60% trades have shown positive alpha. Out of remaining 40%, system has already thrown out (closed position) 30% of them ( 6 positions are closed). In spite of bearing loss in 6 bad trades and 3 not so good trades we have created a favourable gap of 5.67% (NIFTY has lost 8.43 while Rule-X strategy has lost only 2.76). By any standard 5.67% is a decent 'Alpha'. Further we analysed investment from APS perspective. APS is different in two ways: 1. It advocates diversity (See Rule-D & Portfolio Builder ) 2. It asks investors to do weekly trading (Monday morning)
Out of 19 trades 1 trade has been eliminated because Rule-X signal expired before next Monday (trading day). See, Kirloskar Oil. 4 stocks (ECLERX, CLARIANT, ELGI, WIPRO) were out of the scope because system was not able to accommodate them under diversity criteria (Rule-D). See Portfolio builder, for exact ratio of stocks from various SAFE group (we have assumed 20 stocks portfolio)
Out of 19 trades 1 trade has been eliminated because Rule-X signal expired before next Monday (trading day). See, Kirloskar Oil. 4 stocks (ECLERX, CLARIANT, ELGI, WIPRO) were out of the scope because system was not able to accommodate them under diversity criteria (Rule-D). See Portfolio builder, for exact ratio of stocks from various SAFE group (we have assumed 20 stocks portfolio)
| SAFE Group | Name | Trigger Day | Last Trade Day | Last Trade Price | Trading Day | Trading Day Price | Square Off Day | Square Off Price | APS PL(%) | Weighted PL(%) |
|---|---|---|---|---|---|---|---|---|---|---|
| G | GULF OIL CORPORATION LTD. | 01-07-13 | 67.15 | 08-07-13 | 77.55 | -13.41 | -0.67 | |||
| C | UNITED BREWERIES LTD. | 02-07-13 | 651.2 | 08-07-13 | 847 | -23.12 | -1.16 | |||
| A | CAPITAL FIRST LIMITED | 03-07-13 | 150.1 | 08-07-13 | 150.55 | -0.30 | -0.02 | |||
| B | BOC INDIA LIMITED | 08-07-13 | 249.15 | 15-07-13 | 269.45 | -7.53 | -0.38 | |||
| D | HEXAWARE TECHNOLOGIES LTD. | 08-07-13 | 113.95 | 15-07-13 | 97.95 | 16.34 | 0.82 | |||
| D | GEOMETRIC LTD | 10-07-13 | 30-07-13 | 79 | 15-07-13 | 102.9 | 05-08-13 | 70.3 | -31.68 | -1.58 |
| D | POLARIS FINANCIAL TECHNOLOGY LTD | 11-07-13 | 31-07-13 | 99.9 | 15-07-13 | 118.2 | 05-08-13 | 113.75 | -3.77 | -0.19 |
| D | INFOSYS LTD | 12-07-13 | 3007.1 | 15-07-13 | 2791.3 | 7.73 | 0.39 | |||
| F | PIRAMAL ENTERPRISES LIMITED | 17-07-13 | 578 | 22-07-13 | 599 | -3.51 | -0.18 | |||
| E | HERO MOTOCORP LIMITED | 29-07-13 | 1899.45 | 05-08-13 | 1803.75 | 5.31 | 0.27 | |||
| A | S E INVESTMENTS LTD. | 29-07-13 | 391.3 | 05-08-13 | 393.35 | -0.52 | -0.03 | |||
| C | JUBILANT FOODWORKS LIMITED | 29-07-13 | 07-08-13 | 1068.5 | 05-08-13 | 1157.7 | 12-08-13 | 1065 | -8.01 | -0.40 |
| C | MARICO LIMITED | 30-07-13 | 07-08-13 | 201.6 | 05-08-13 | 212.5 | 12-08-13 | 201.95 | -4.97 | -0.25 |
| A | MANAPPURAM FINANCE LIMITED | 31-07-13 | 14.93 | 05-08-13 | 12.85 | 16.19 | 0.81 | |||
| Sum: | -2.56 |
Hence, APS investors have lost 2.56% only while NIFTY during the same period has lost 8.43%. This means APS has generated 5.87% 'Alpha'.
Conclusion:Rule-X and APS both are generating significant Alpha. It means they are capable of outperforming the benchmark (NIFTY) in the long term. NIFTY itself is returning decent profits (NIFTY Historical Return) in the long run. So, APS and Rule-X which are outperforming NIFTY will also return decent profits in the long run.
Conclusion:Rule-X and APS both are generating significant Alpha. It means they are capable of outperforming the benchmark (NIFTY) in the long term. NIFTY itself is returning decent profits (NIFTY Historical Return) in the long run. So, APS and Rule-X which are outperforming NIFTY will also return decent profits in the long run.
Do you have any query? Please write to us:
Did you like this article? Please share it with your social network