Article Reader

Why APS for Fixed Deposit Investors
Fixed Deposit is the darling of many investors. There are solid reasons behind the same. It provides security and enhances predictability in life. We compare the same with a fixed salary job. In any situation person is sure of what he will get at the end of the specified period. At the other end, stock market is highly unpredictable and even with a rock solid strategy no one can get consistent returns on periodic basis. It is just like freelancers' job. One month you can get up to five times of regular job while the very next month income will be zero. In the case of fixed salary job employers play crucial role and they ensure consistency. Employers mitigate the business risk and uncertainty, so, they pay keeping in mind the worst scenario possible. Same thing happens with banks, they also provide interest with very safe margin in their hands. See the following graph which is showing NIFTY performance across 10 years.
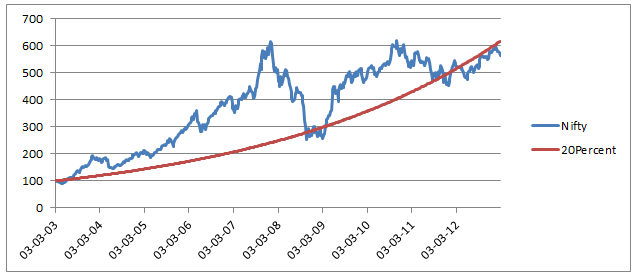
NIFTY Growth Across 10 Years
NIFTY is the Indian stock market average, it means stock market has grown by 20% compound growth rate across 10 years period. Now, you can imagine how banks have given you secured return on Fixed Deposit and what margin they have kept. Coming to our job analogy, we need a secure job. However we also get bored with fixed income if it is not associated with performance. So, a job with fixed salry plus performance based incentive is highly desirable. Mapping the same to stock market, we need fixed return plus market linked return. As market performs better we should get better return as bonus which will take care of inflation etc. APS (Active Portfolio Service) provides strategy framework (see Secret Behind) and automation which statistically proves to return around 20% per annum across 5 years of time (check out our tool Portfolio Builder to verify the same). Based on random generation of results from Portfolio Builder tool following is distribution chart which is showing around 21% median return and 80% investors got in the range of 15-26%
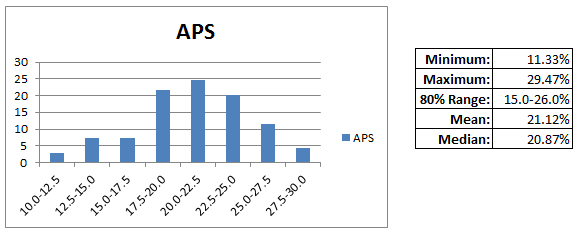
APS 5 Years Average Returns Distribution
We simulated the equivalent of a job with performance linked bonus scenario with the help of typical APS portfolio return. We fused 50% of the investment in instrument like FD (assumed 9%) and rest 50% in APS. Following chart shows a typical return graph for the three scenarios with the base starting point Rs.100.
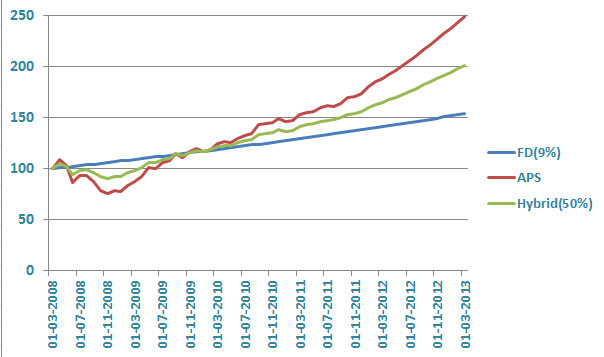
APS, FD, & FD Hybrid Performance
In above analysis we have taken division of capital 50-50% on each side. Individual investor can select any ratio depending on his/her risk appetite. To know how APS (Active Portfolio Service) works, visit the following link How It Works Conclusion: Following the middle path of Buddha philosophy provides stability as well as market linked return. It is wise to distribute the investment across fixed income and market linked income to get stability as well as growth.
Do you have any query? Please write to us:
Did you like this article? Please share it with your social network