Article Reader

Relative Beta
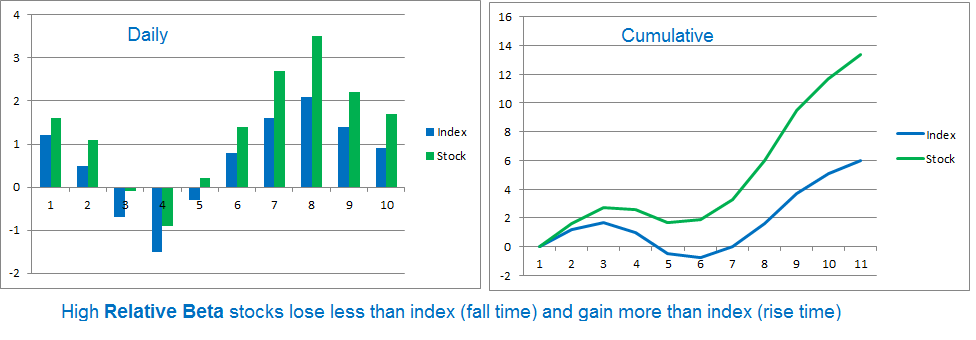
Market goes up and down and so does your investment value. However, some stocks goes down with market and do not recover as smartly as the market while others bounce back even better than market. At SafeTrade we studied this behaviour very closely and brought out a statistical model which numerically measures this behavour in the range of -2 to +2. We have named it Relative Beta A stock which loses less than the index during falling market and gains more than index has typically high Relative Beta value and stock contrary to it has low relative beta value. Following chart is depicting behaviour of a typical high Relative Beta stock and its growth chart.
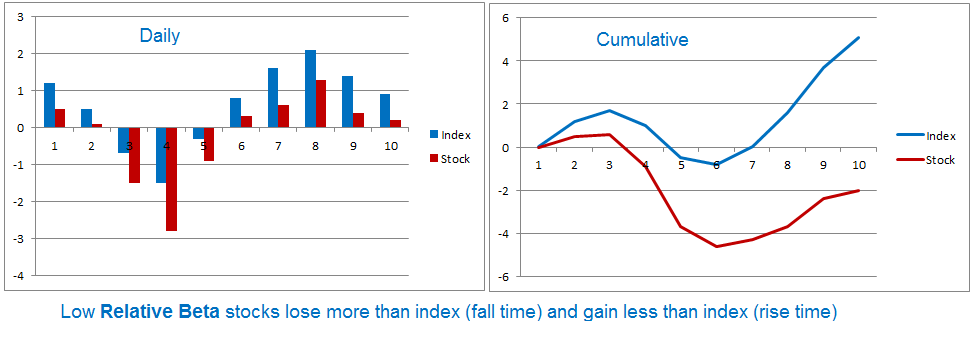
Following chart is showing a typical low beta stock behaviour and its growth chart.
Let us have a look at current (5th Oct. 2015) high Relative Beta stocks and correlate it with stocks' last 50 days performance and Safe rated health (which indicates health of a stock in very short period)
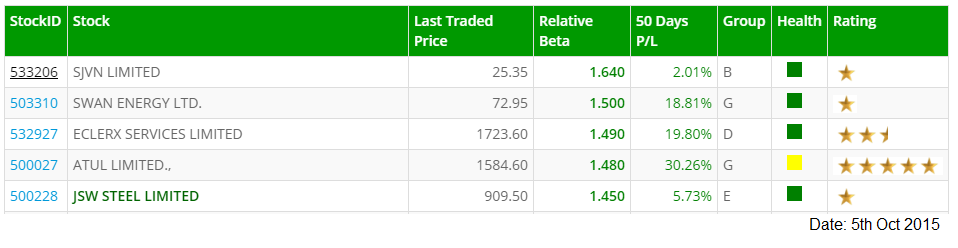
High Relative Beta stocks typically performs good
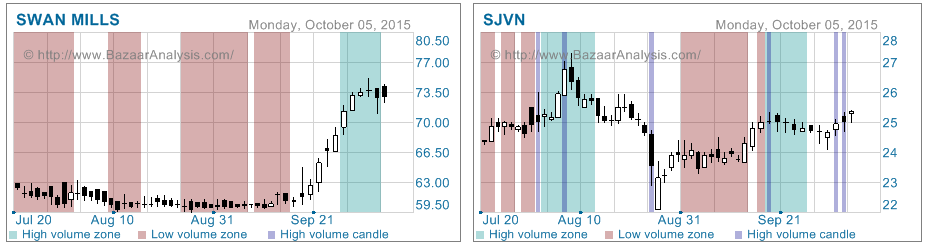
We can clearly see that most of the stocks have performed well. One stock (SJVN) may look contrary but even this stock has performed much better than index (which has lost around 6% during the same time). Swan & SJVN both have strongly resisted aganist the falling market and so both of them have been rated high on Relative Beta.
High Relative Beta Sample Stocks
Moving ahead to see the current extreme low RelativeBeta stocks, we find that most of the time it has correlation with last 50 days performance and Safe health rating.
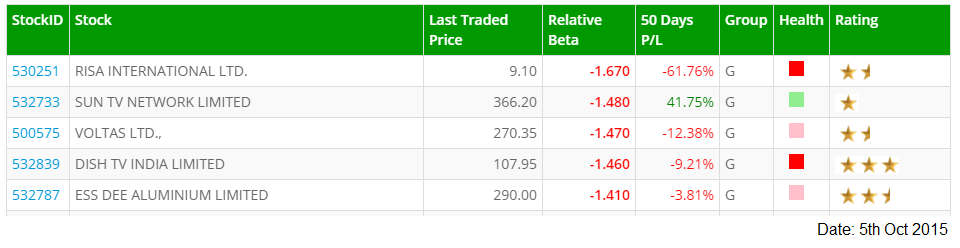
Low Relative Beta stocks typically performs bad
Here you may notice one exception again (SUN TVNET). This is because the stock had moved rapidly in the begining of the cycle while later on it was highly volatile. Our implementation of Relative Beta focuses more on 5-7 weeks performance not beyond that. So, inspite of significant upward move in last 50 days this stock has a visible element of risk on basis of which our Relative Beta model alerted negatively about it.
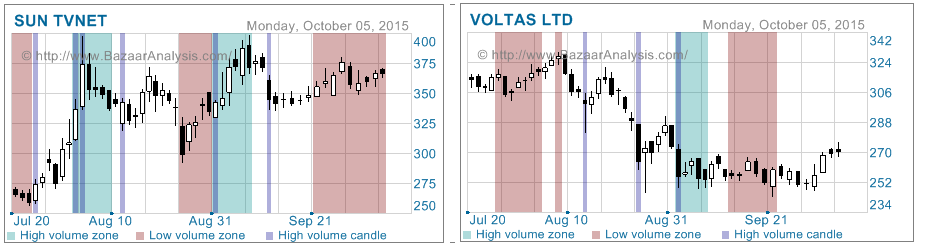
Low Relative Beta Sample Stocks
Relative Beta value for all stocks have been included as part of regular stock review for all stocks. Apart from that we also publish top and bottom 100 Relative Beta stocks as part of Premium Reports Disclaimer: Definition of Relative Beta is presented in extremely simplified form here. In real scenario with normal human observation we can not figure out the behaviour of any particular stock. Computation of Relative Beta is subject of complex algorithm based on statistics & probability. Advance stock market players know some stoks are bound to behave just contrary to the market index. We also have accomodated those stocks under Relative Beta measurment by complimenting the behaviour.
Do you have any query? Please write to us:
Did you like this article? Please share it with your social network