Article Reader

Buying Grocery Vs. Stocks: Shall We Buy At Every Dip?

“Buy at every dip”- Sounds familiar? It also appears logically convincing to us. It is no-brainer that if we buy at low and sell at high then we will make profit. We correlate this experience somewhere with our regular grocery buying experiences. We know if “Tropicana Juice” is available at 20% discount then it is worth to buy and store for near future. We know “Tropicana Juice” with MRP. Rs.100 is never going to be less than that and it may go from Rs.100 to Rs.125. In nutshell we have experience that grocery price oscillates in narrow range and overall it moves upward. This is absolutely not true in case of stocks. Neither stocks are bound to oscillate in narrow range nor do they guarantee that they will move upward always. Let us have a quick look of the year 2015 top 5 gainer and looser stocks (within Top 500).
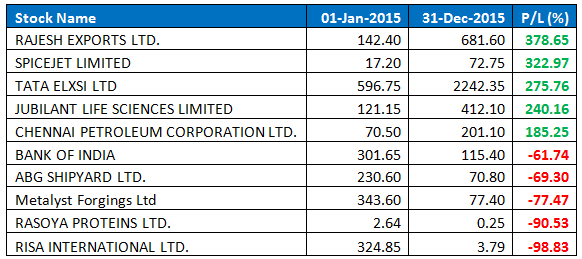
Can you imagine a grocery price varying in this range? If we are equating our experience of grocery buying with stocks, it means we have to believe “Tropicana Juice” with Today’s MRP Rs.100 is going up within a year to MRP Rs.500 or coming down to MRP Rs.1.25 within a year. If inherent behaviour of these two entities is so different then applying experience of one to another will bound to be fatal. Buy more & average out your price. Does it sound familiar to you? This is another trap which will strangulate you till the point of no return. Let us have an imaginary situation. On January 1, 2015 you had invested equal amount (Rs.10,000) in two stocks RAJESH EXPORTS & RISA INTERNATIONAL (selecting best and worst performer). You have another Rs.80,000 cash for future investment. RISA INTERNATIONAL started falling and as usual at every 10% fall you invested further Rs.10,000 in the falling stock. Following table is summarizing your transactions and final outcome.
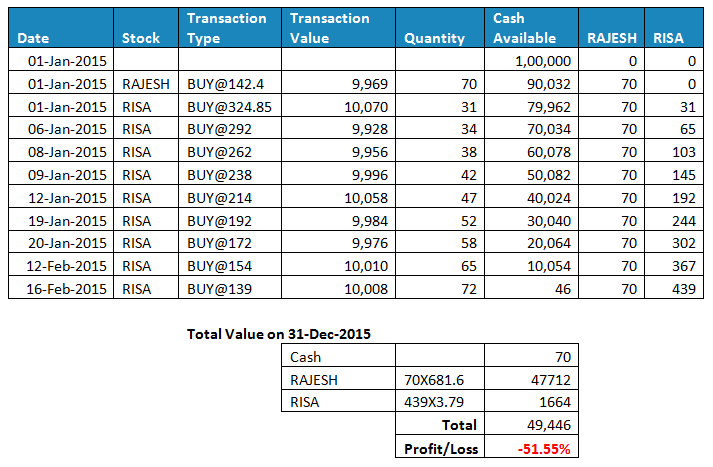
Wow! In spite of you choosing one best performer of the year stock, you are at loss of 51.55%. Now let us imagine, you would have avoided average out strategy for RISA and just remained with Jan 1, 2015 transactions.
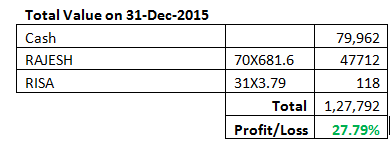
In spite of losing almost all in one worst performer you are sitting at top of more than 30% profit (add 4% interest in saving account on your cash) Now, let us imagine you followed our typical recommendation to not bear loss of more than 20% on a single stock (Rule-X) . You would have been exited from RISA at price Rs.259.
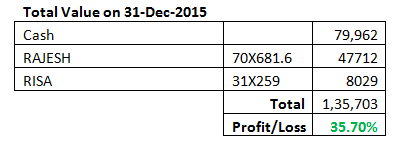
Awesome! You have now 35.7% profit (include saving account interest and it will become nearly 39%. So, let us have a macro picture. During year 2015 NIFTY fell by 5.35%.
- If you would have followed average out strategy then you had chance of 51.55% loss
- If you would have avoided averaging strategy then you had a chance of 30% profit
- If you would have followed Rule-X (get out at nearly 20% loss) then you had a chance to make ~40% profit
- If you would have invested remaining Rs.80,000 also in the market with Rule-X strategy then …. (I leave it to your imagination)
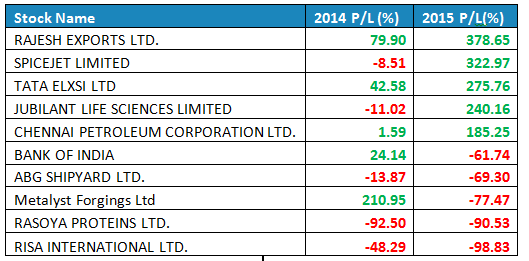
In each group you can see majority of the stocks have followed trend of the previous year (3 out of 5). Another very important observation is that the stocks which have lost less than 20% have made breakthrough performance next years. The stocks which were already at more than 20% loss have made further bigger losses. Good performing stocks also go through downward trend when overall market is down. Nevertheless, there is a subtle difference in their downward trend and bad performer trend. Bad performers will show poorer performance than index while good performer will perform better than index. At SAFE Trade we measure this behaviour with a statistical model called Relative Beta . Good stocks always show positive Relative Beta (often more than 1) while bad stocks show negative Relative Beta (often less than -1). See the following chart which has three stocks with positive Relative Beta. You can see, they are also going up and down. However, they are doing better than index (NIFTY). It means, buying them even during the dip could be a wise decision.
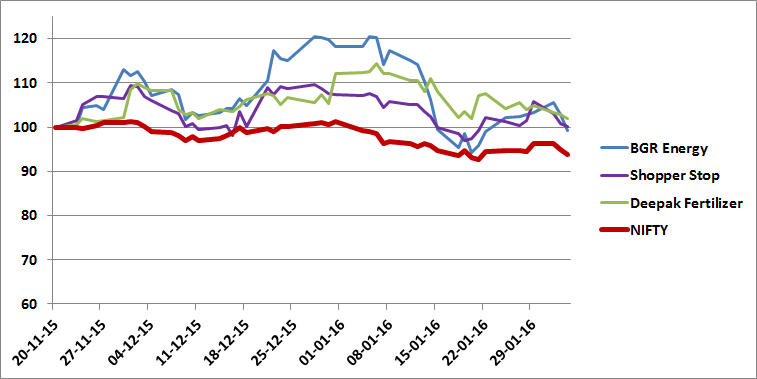
High Relative Beta Stocks
Following chart is showing trends relative to NIFTY for some of the stocks having negative Relative Beta.
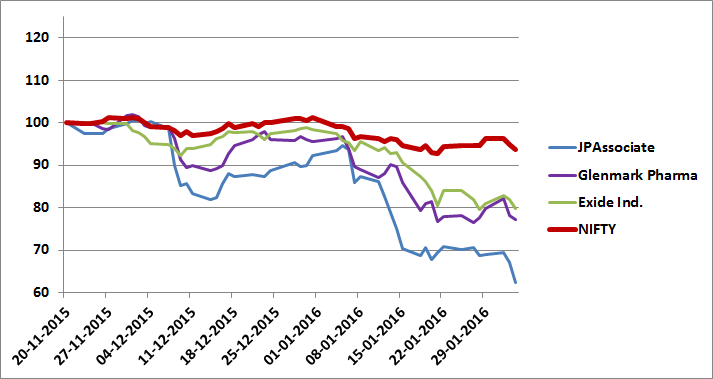
Low Relative Beta Stocks
Following table is showing exact Relative Beta of the stocks mentioned in above charts.
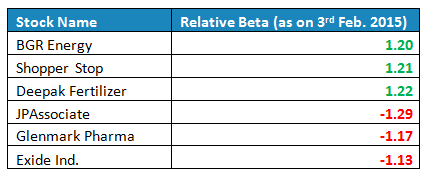
Conclusion: Buying at every dip is a fatal strategy. We may buy some of the stocks when they are dipping in shorter period of time, but we need to validate they are dipping less than index (NIFTY) at least in last couple of weeks. Relative Beta (range value -2 to +2) is a proposed indicator to measure the relative strength of a stock with respect to index. If a stock is having less than -1 Relative Beta then we strongly recommend to sell such stocks (do not make mistake of averaging out). If a stock has more than +1 relative beta then you may buy this stock for short term gain but for long term perspective you need to follow our Portfolio Diversity, Money Distribution and Star Rating systems. To know more about long term investment strategy, download free investment guide from the following link Stock Investment Guide for Retail Investors If you liked this article then register yourself with us. You will receive early alert about our future articles in your mail box. You may help your friends and folks in social network by sharing this article.
Do you have any query? Please write to us:
Did you like this article? Please share it with your social network