Article Reader

Guided Tour: Intermediate Investors (2-5 yrs. experience)
INTRODUCTION: Welcome to SAFE. As acronym suggests safety, indeed we mean that. We have created a framework SMART which is proven to return decent profits in the long term. Being an intermediate investor, we are assuming you have either mixed or loss making experience in the stock market. Some of you may have decided not to look back into the stock market. If contrary to our assumption you have overall positive experience then congratulations you have qualified for Senior Investors category. In our study of intermediate category of investors, we have found that they have committed two types of mistakes mostly. 1. Invested in non-liquid stocks (also called penny stocks). It appeared to be very profitable at the point of investment and then started making loss and finally lost up to 80-90% of investment value (sometime the company also vanished ) 2. Given exposure to only one or two sectors of stocks. Reason, they were cheap (violated Rule-X). To make things from bad to worse they bought more stocks at lower price with the logic of averaging out (read story of Mr. A.V.Gupta). YOUR POTENTIAL: If they would have avoided the two mistakes then statistics suggests they would have potentially earned 14% compound interest yearly with variation of 5% in each side. Given below is the chart on the basis of portfolios created by mix type of visitors to our website. They followed our guidelines to avoid the above two mistakes and their earnings (in term of yearly compounding) in the last 5 years are captured in the chart.
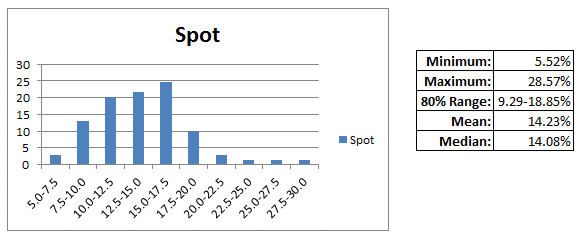
Yearly compounding interest earned by percentage of spot investors
Above result is on basis of the set of stocks bought five years back and held for the next five years (We call it Spot Investors strategy). If you are surprised and have element of doubt at the back of your mind then check our other article Why SAFE to realize what potential the market had to offer you in the past. You also have opportunity to validate this claim. We will explain the available tool (Portfolio Builder) for the same in validation section.
POWER OF ONE RULE: We have introduced a concept Rule-X, according to which one has to sell a stock if it is on downward trend and only buy if it has given sufficient signal for upward trend. For more details about the rule click here. The above rule and earlier guideline about stock selection and portfolio building has been bundled together in a framework. We have published the same in the name of SMART Investment Framework under our policy of Open Strategy. To help the investors, we have introduced a product based service APS which helps investors to follow the SMART rule almost with no extra burden. Following chart has summarized the results obtained for APS investors for the same set of portfolios mentioned in the previous section.

Yearly compounding interest earned by percentage of APS investors
Essentially, in above chart we have only extra logic of Rule-X. This has improved average return by 7%. Apart from improvement in yearly return we have two more benefits in case of APS. For details see the following links: 1. MUF 2. APS Intangible Benefit VALIDATION: We have provided a tool to validate the effectiveness of balanced portfolio. Tool is accessible through main menu of the website (Portfolio Builder) User needs to go through following steps. STEP 1: Select your budget. Default is Rs.5,00,000. This figure has nothing much to do with final performance of the portfolio. However, it will help in visualizing how actually your investment would have changed in term of figure.
STEP 2:Select number of stocks. Default is 20 and one can chose from 10 to 20 any number. Below 10 it is not possible to really create diversification and beyond 20 we think situation may be un-manageable. STEP 3: Follow the condition given in table to select stocks of your choice. The table has put condition to select minimum number of stocks from each group. Select stocks from different groups according to that. Keep in mind you have upper limit also set at STEP 2. Hence, maximum 1-2 stocks are allowed to go beyond the minimum restriction If you have finished STEP 3 then status columns (left most) in condition table will show green check at every row. Now click the button "Test Portfolio Performance" on right side of condition table. In few seconds your report will be ready. If you wish you can email this report to yourself (Look for option at right bottom). HOW TO USE OUR SERVICE: Step 1: Create Login (No charges involved) Step 2: Create portfolio. Portfolio may be created in two ways. If you do not have any exposure to equity market and you are just inspired by us to try this then Portfolio Builder is the tool which will help you to do the same. In case you already have some exposure then do the entry in our portfolio system. Try out "What IF.." feature associated with portfolio. This will give you information about sector wise exposure you have taken. On basis of your budget and number of stocks, create a session at portfolio builder and match the recommendations per sector basis. If you are within the recommended guideline then your portfolio is ready else try to make your portfolio compliant with the guideline. Step 3: Activate your portfolio (Look for "Activate" Button ). Step 4: Wait for weekend (Friday or last trading day of the week) report Step 5: If some actions are required then execute on Monday (or next trading day) morning.
Step 6: Go back to Step 4
Do you have any query? Please write to us:
Did you like this article? Please share it with your social network